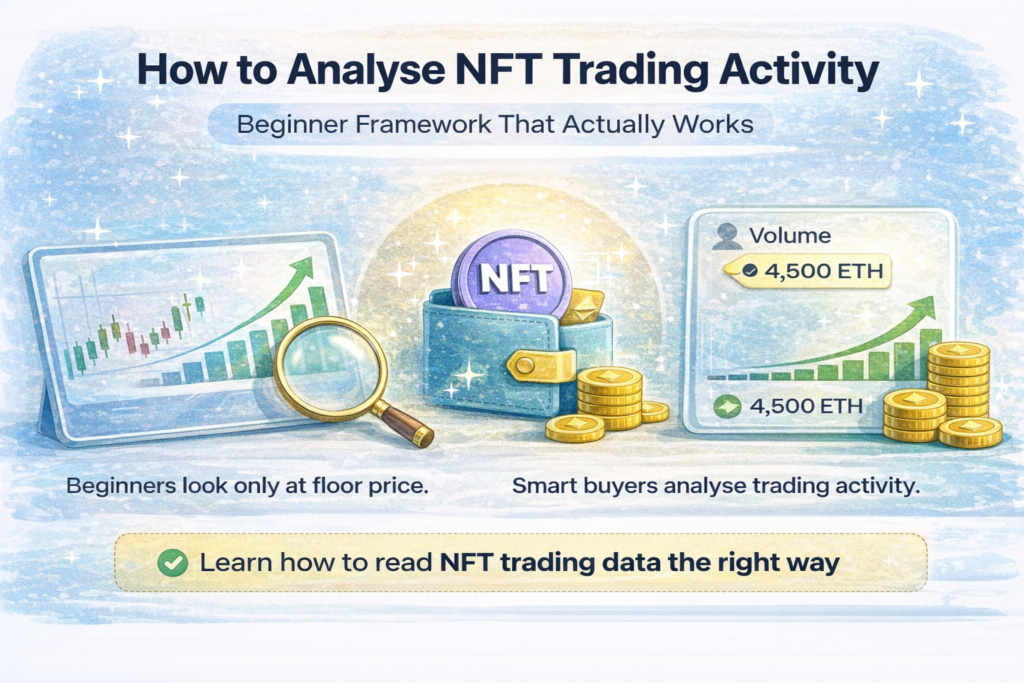
How to Analyse NFT Trading Activity (Beginner Framework That Actually Works)
If you want to move beyond guessing, you need to understand how to analyse NFT trading activity properly.
Many beginners look only at floor price.
Smart buyers analyse trading activity — because trading activity reveals real demand, liquidity, and risk.
Before analysing any NFT collection, make sure you’re using a secure wallet setup. If you haven’t chosen one yet, start with one of the best NFT wallets for beginners to protect your assets before interacting with marketplaces.
👉 Best NFT Wallets for Beginners: Safe & Easy Options to Get Started
Once your wallet is secure, here’s how to read NFT trading data correctly.
What Is NFT Trading Activity?
NFT trading activity refers to the total buying and selling behaviour within a collection over a specific time period. It shows whether people are actually trading — not just listing.
It includes:
- 24-hour volume
- 7-day volume
- Number of sales (transaction count)
- Unique buyers and unique sellers
- Transaction frequency over time
Unlike floor price, NFT trading activity can reveal real market demand and liquidity.
For the core metric behind most trading dashboards, read: what is NFT volume.
And if you’re still learning the basics, start here: how to research NFTs before buying.
Why Analysing NFT Trading Activity Matters
Understanding how to analyse NFT trading activity helps you:
- Identify genuine demand
- Avoid dead collections with low liquidity
- Spot artificial hype and manipulation
- Reduce risk before buying
Floor price alone can be misleading. To understand why, read: NFT floor price vs volume explained.
If you want the “what is floor price” definition, see: what is a floor price in NFTs.
Step-by-Step: How to Analyse NFT Trading Activity
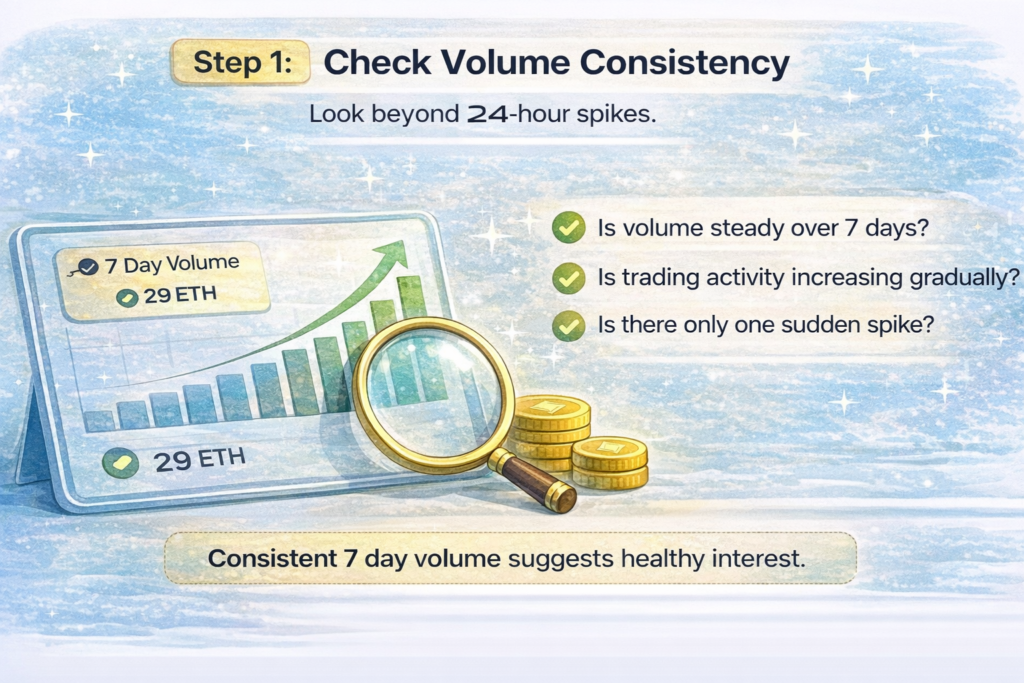
Step 1: Check Volume Consistency
When analysing NFT trading activity, look beyond 24-hour spikes. One-day volume can be hype-driven or artificial.
Ask:
- Is volume steady over 7 days?
- Is trading activity increasing gradually?
- Is there only one sudden spike?
Consistent volume usually suggests healthy interest and real participation.
If you’re still learning how to interpret the “floor + volume” relationship, see: how to check NFT floor price.
Step 2: Compare Buyer vs Seller Activity
Healthy trading activity includes:
- Multiple unique buyers
- Multiple unique sellers
- Balanced participation (not just constant undercutting)
Red flag signs:
- One wallet buying repeatedly
- Very few unique buyers across many sales
- Large price jumps without broader participation
This can indicate artificial movement, wash trading, or controlled liquidity.
If you’re learning how to spot strong demand signals overall, read: how to spot strong NFT demand (ARTICLE COMING SOON)
Step 3: Analyse Wallet Distribution
When analysing NFT trading activity, check holder distribution because concentration increases risk.
Look at:
- Top holder concentration
- Percentage owned by the largest wallets
- Distribution across unique holders
If 5 wallets hold 70% of supply, liquidity risk is high — price and volume can be manipulated more easily.
For a structured review process, use: NFT due diligence checklist.
And for a deeper evaluation framework, see: how to evaluate NFT projects.
Step 4: Identify Wash Trading Signals
Wash trading occurs when the same wallet (or connected wallets) trade NFTs between themselves to inflate volume and create fake demand.
Warning signs:
- Repeated transactions between the same addresses
- Unrealistic price jumps with low unique buyers
- Sudden high volume without organic community growth
Also watch for security red flags around “too good to be true” mints and marketplace links. Start here: how to avoid NFT scams.
And if you want to understand how approvals can be abused, read: what is a malicious smart contract (ARTICLE COMING SOON)
Step 5: Connect Trading Activity to Floor Price
The most important part of analysing NFT trading activity is combining it with floor price.
Healthy scenario:
- Rising floor price
- Consistent volume
- Growing buyer count
Unhealthy scenario:
- Rising floor
- Falling volume
- Few unique buyers
That’s where risk increases — because listings can stay high while real demand disappears.
If you want the floor-price definition and why it can mislead, read: what is a floor price in NFTs.
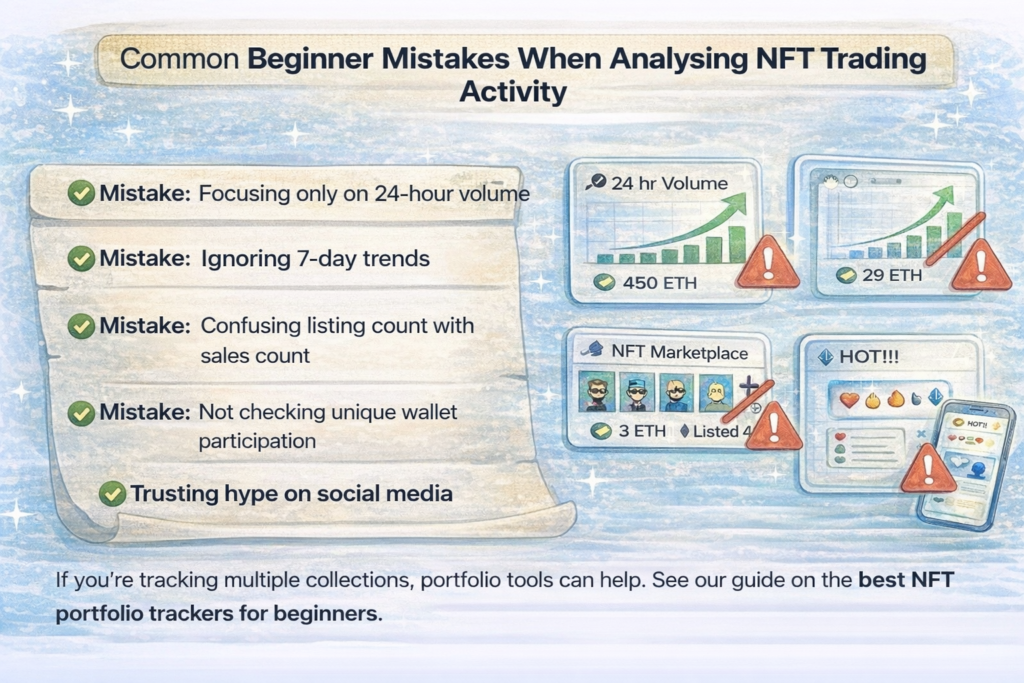
Common Beginner Mistakes When Analysing NFT Trading Activity
- Focusing only on 24-hour volume
- Ignoring 7-day trends
- Confusing listing count with sales count
- Not checking unique buyer participation
- Trusting hype without verifying on-chain data
If you’re tracking multiple collections, tracking tools can help you stay organised. See: best NFT portfolio trackers.
Tools to Analyse NFT Trading Activity
To analyse NFT trading activity effectively, use:
- Official marketplace stats (floor, volume, sales)
- NFT analytics platforms (trend charts and buyer metrics)
- Portfolio tracking dashboards (your holdings and history)
- Blockchain explorers (contract, wallet, and transaction verification)
To start with beginner-friendly tools, see: best NFT tools for beginners.
And if you want a dedicated tracking workflow, read: how to track NFT performance over time.
Quick Checklist: How to Analyse NFT Trading Activity
Before buying any NFT, ask:
✔ Is volume consistent over 7 days?
✔ Are there multiple unique buyers and sellers?
✔ Is holder distribution balanced?
✔ Is floor price supported by activity?
✔ Is the marketplace legitimate?
✔ Is my wallet secure?
If you want a broader “buying checklist” framework, use: NFT due diligence checklist.
Final Thoughts
Learning how to analyse NFT trading activity gives you a clearer view of demand strength, liquidity, market health, and risk.
Data doesn’t guarantee outcomes — but ignoring trading activity increases risk dramatically.
Combine:
- Floor price
- Trading volume
- Sales frequency
- Unique buyers
- Wallet distribution
- Secure wallet setup
That’s how beginners transition from guessing to informed decisions.
If you haven’t already, start with your wallet foundation here: best NFT wallets for beginners.
FAQ Section
What is NFT trading activity?
NFT trading activity refers to the buying and selling behaviour within a collection, including volume, sales count, unique buyers and sellers, and transaction frequency.
Why is trading activity more important than floor price?
Trading activity reflects real demand and liquidity, while floor price only shows the lowest listing and can stay high even when buyers disappear.
How do you spot fake NFT trading activity?
Look for repeated transactions between the same wallets, unrealistic price jumps, sudden volume spikes, and low unique buyer participation.
What tools help analyse NFT trading activity?
Official marketplaces, NFT analytics tools, portfolio trackers, and blockchain explorers.